Poisson distribution on football
Poisson Distribution
The Poisson can be used to model soccer matches. The graph below shows the the distribution of goals scored by a team playing at home over a season in a league competition. Their average was 1.00 goals/match.
As can be seen, the Poisson model describes the team’s goal scoring achievements over the season. However, this model should be treated with care as there are a number of caveats, including:
Competing teams should be of comparable ability
Statistics should be compiled from games where the opposing teams are of comparable ability, this may be reasonable for games played in a league competition, however, games played in knock-out competitions may give a distorted impression of the team’s ability. In short we can’t compare two football team using statistics from different competitions. For example data from Premiership is not valid for FA cup and reverse.
Home and away performance may different
Typically teams perform better on their home ground that at away fixtures, therefore care should be taken to separate the two. I have some pages to add here, like “Home field advantage”.
Teams change over the season
For the model to have any validity, the composition of the team should be constant over the season with the same manager working with the same squad. However, it is very hard to monitor all. Players come and go because of loans and transfers. Within the squad availability will be determined by injuries and suspensions. It may be able to get a better model of a team’s performance by considering the player’s who are available for a given game rather than rely on historic performance. We do not include this in our football predictions. Name of the team is not important for the system, it use only numbers to produce tips.
Whilst statistics can be an attempt at informed speculation, don’t ignore the roll of chance otherwise football would not have its magic.
Poisson Distribution on football
In probability theory and statistics, the Poisson distribution is a discrete probability distribution that expresses the probability of a number of events occurring in a fixed period of time if these events occur with a known average rate and independently of the time since the last event. The Poisson distribution can also be used for the number of events in other specified intervals such as distance, area or volume.
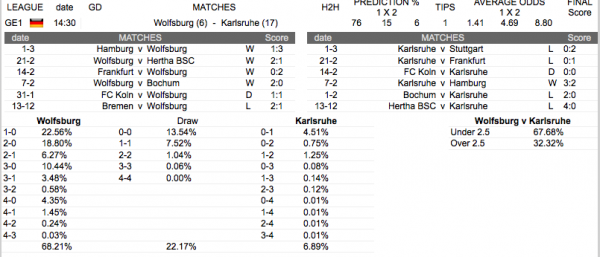
Before we take Poisson distribution we should have some historical data for the event.Lets says we are going to predict the outcome for Wolfsburg – Karsruhe
Before we start to perform distribution let first look at the formula.
“he distribution was discovered by Siméon-Denis Poisson (1781–1840) and published, together with his probability theory, in 1838 in his work Recherches sur la probabilité des jugements en matières criminelles et matière civile (“Research on the Probability of Judgments in Criminal and Civil Matters”). The work focused on certain random variables N that count, among other things, a number of discrete occurrences (sometimes called “arrivals”) that take place during a time-interval of given length. If the expected number of occurrences in this interval is λ, then the probability that there are exactly k occurrences (k being a non-negative integer, k = 0, 1, 2, …) is equal to”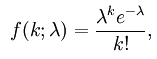 where
where
- e is the base of the natural logarithm (e = 2.71828…)
- k is the number of occurrences of an event – the probability of which is given by the function
- k! is the factorial of k
- λ is a positive real number, equal to the expected number of occurrences that occur during the given interval. For instance, if the events occur on average 4 times per minute, and you are interested in the number of events occurring in a 10 minute interval, you would use as your model a Poisson distribution with λ = 10*4 = 40.
Now the real part. Here is function written in PHP
function calc_poisson($score_required,$average_score) {
return pow($average_score,$score_required)*pow(2.718,-$average_score) / factorial($score_required);
}
All spreadsheet include this formula, and you can use it easy.
=poisson(x,mean,cumulative)
let say we test 1-0 result. And goals for last 6 games for Wolfsburg are 11 $average_score = 11/6=1.83
Total goals for the visitor Karsruhe are 3, so $average_score = 3/6=0.5
Now perform Poasson distribution 2 time.
calc_poisson(1, 1.83);
calc_poisson(0, 0.5);
The result from the 2 calculations are multiple and the result is calculated percent for result 1-0.
Iterate all mayor scores and we can calculate 1×2 probability.
On the pictures above you can see that the result 1-0 is 22.56% to be final.
sources: